데이터 : 전력거래소 신재생에너지 데이터(에너지원별, 시간별) 기간 : 2019-2021년
In [1]:
import numpy as np
import pandas as pd
import matplotlib.pyplot as plt
In [2]:
plt.rcParams['figure.figsize'] = (14, 9)
plt.rcParams['font.family'] = 'Malgun Gothic'
plt.rcParams['font.size'] = 12
plt.rcParams['axes.unicode_minus']
Out[2]:
In [3]:
# 데이터 읽고, 시간, 일 데이터 정리하는 함수
def data_setting():
    df = pd.read_excel('신재생발전량및설비용량_2019_2021.xlsx')
    df = df.set_index('거래일자')

    pv = df[df['연료원구분'] == '태양광'].copy()
    wt = df[df['연료원구분'] == '풍력'].copy()

    pv_hour = pv.drop('연료원구분', axis=1)
    wt_hour = wt.drop('연료원구분', axis=1)

    pv_hour['이용률'] = pv_hour['전력거래량(MWh)'] / pv_hour['설비용량(MW)'] * 100
    wt_hour['이용률'] = wt_hour['전력거래량(MWh)'] / wt_hour['설비용량(MW)'] * 100

    pv = pv.reset_index()
    wt = wt.reset_index()
    pv_day = pv.groupby('거래일자').agg({'설비용량(MW)': 'mean', '전력거래량(MWh)': 'sum'})
    pv_day['이용률'] = pv_day['전력거래량(MWh)'] / (pv_day['설비용량(MW)'] * 24) * 100
    # print(pv_day.head())
    wt_day = wt.groupby('거래일자').agg({'설비용량(MW)': 'mean', '전력거래량(MWh)': 'sum'})
    wt_day['이용률'] = wt_day['전력거래량(MWh)'] / (wt_day['설비용량(MW)'] * 24) * 100

    return pv_hour, pv_day, wt_hour, wt_day
In [4]:
# 월로 계절을 구분하는 함수
def to_season(month_num):
    season = 'winter'

    if 3<= month_num <=5:
        season = 'spring'
    elif 6<= month_num <=8:
        season = 'summer'
    elif 9<= month_num <=11:
        season = 'autumn'

    return season
In [5]:
pv_hour, pv_day, wt_hour, wt_day = data_setting() # 데이터 읽기
print(pv_hour.info())
In [6]:
# 전체/4계절 이용률 (시간 기준)
def hour_ur(df, type): # 1 태양광, 2 풍력
df['월'] = df.index.month
df['계절'] = df['월'].apply(to_season)
#print(df)
spring = df[df['계절'] == 'spring']
summer = df[df['계절'] == 'summer']
autumn = df[df['계절'] == 'autumn']
winter = df[df['계절'] == 'winter']
graph = df['이용률'].groupby(df['거래시간']).mean()
graph = pd.DataFrame(graph)
graph.columns = ['전체']
graph['봄'] = spring['이용률'].groupby(spring['거래시간']).mean()
graph['여름'] = summer['이용률'].groupby(summer['거래시간']).mean()
graph['가을'] = autumn['이용률'].groupby(autumn['거래시간']).mean()
graph['겨울'] = winter['이용률'].groupby(winter['거래시간']).mean()
print(graph)
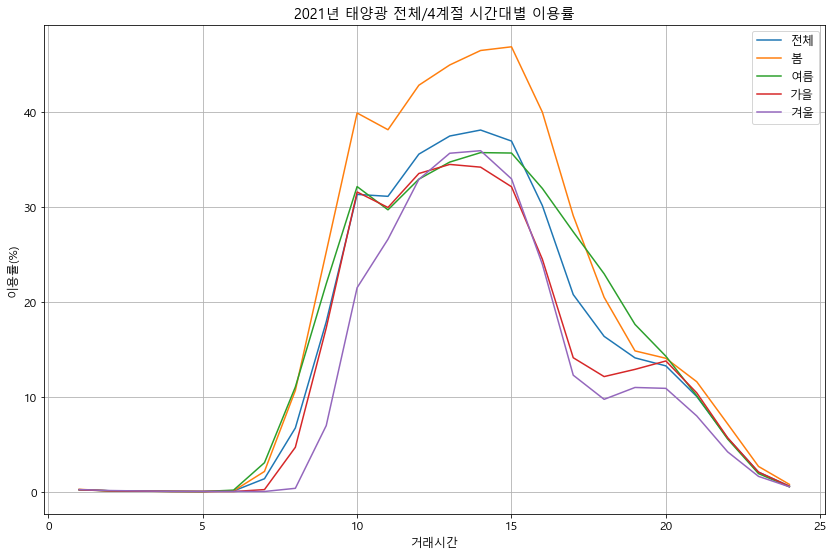
graph.plot()
if type == 1:
plt.title('2021년 태양광 전체/4계절 시간대별 이용률')
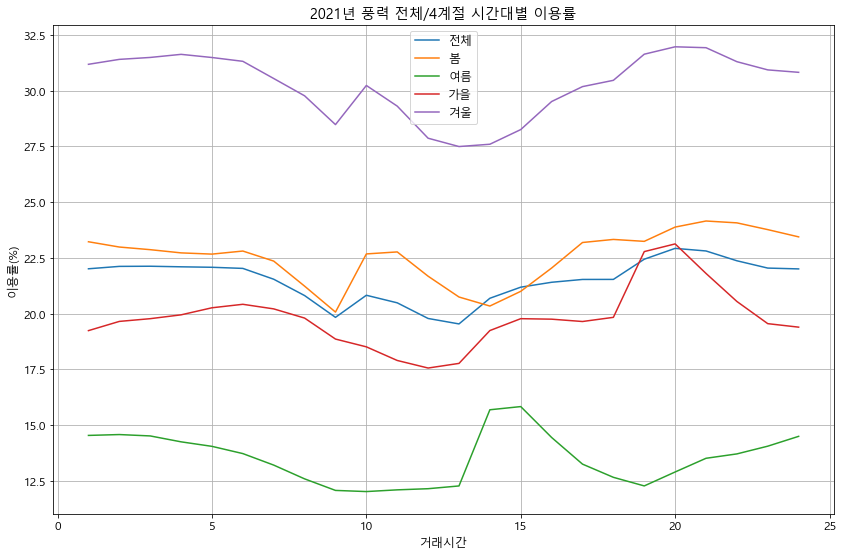
if type == 2:
plt.title('2021년 풍력 전체/4계절 시간대별 이용률')
plt.ylabel('이용률(%)')
plt.legend(loc='best')
plt.grid(which='both')
plt.show()
In [7]:
hour_ur(pv_hour, 1) # 태양광
In [8]:
hour_ur(wt_hour, 2) # 풍력
In [9]:
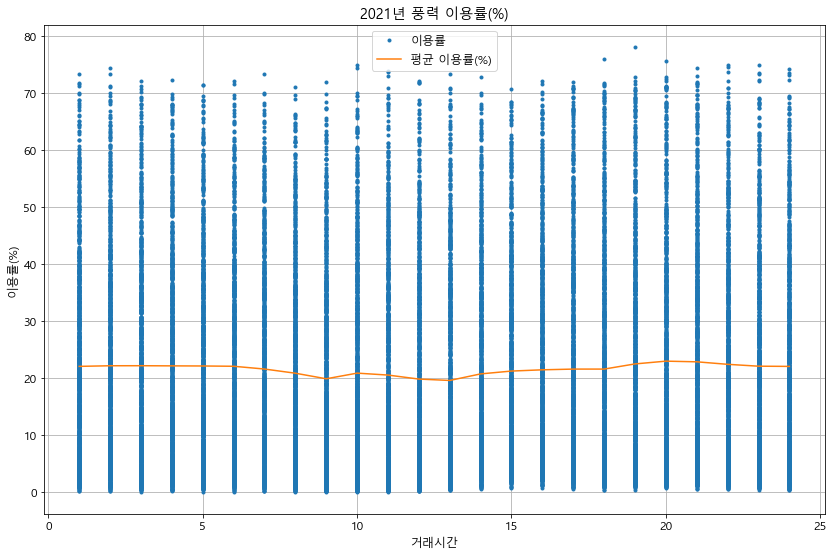
# 산점/라인 이용률 그래프(시간 기준)
def scatter_ur(df, type): # 1 태양광, 2 풍력
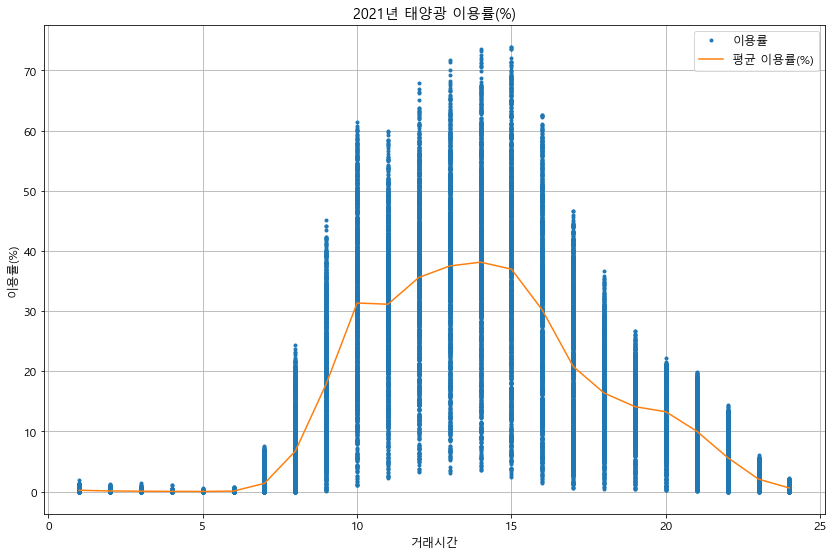
df.plot(x='거래시간', y='이용률', style='.')
df.groupby('거래시간')['이용률'].mean().plot(legend=True, label='평균 이용률(%)')
plt.ylabel('이용률(%)')
if type == 1:
plt.title('2021년 태양광 이용률(%)')
if type == 2:
plt.title('2021년 풍력 이용률(%)')
plt.grid()
plt.show()
In [10]:
scatter_ur(pv_hour, 1) # 태양광
In [12]:
scatter_ur(wt_hour, 2) # 풍력
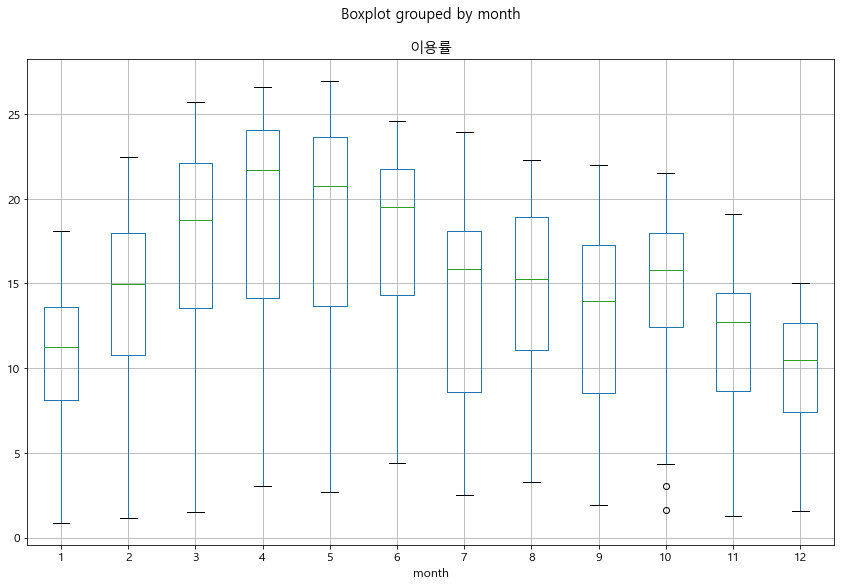
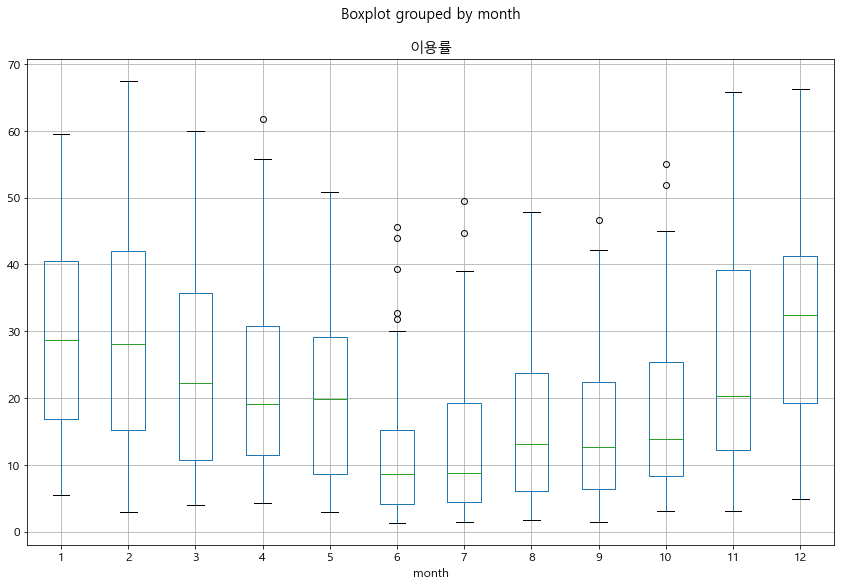
In [13]:
def month_box(df, type):
    #print(df)
    df['month'] = df.index.month
    df.boxplot(column='이용률', by='month')  # 월별로 부하율을 4분위 그래프 그리기
    plt.show()
In [14]:
month_box(pv_day, 1) # 태양광
In [15]:
month_box(wt_day, 2) # 풍력
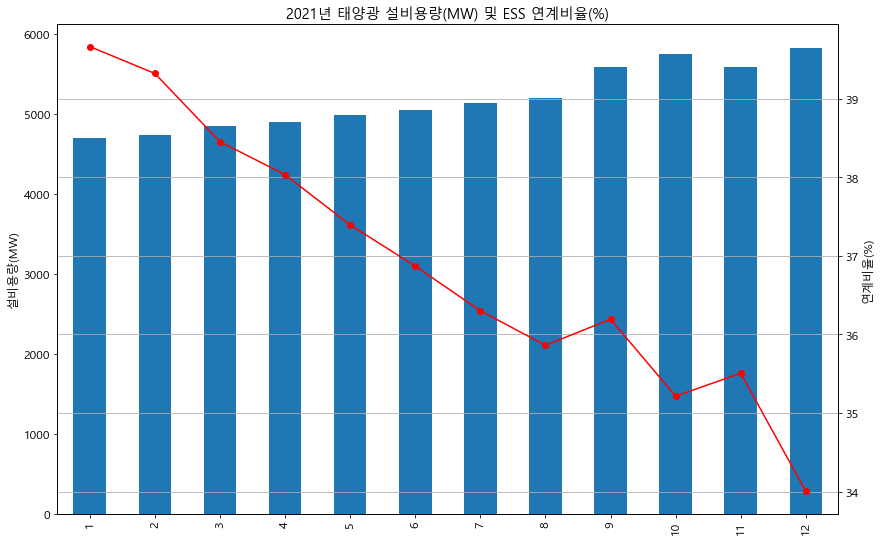
In [16]:
def ess(type): # 1 태양광, 2 풍력
data = pd.read_excel('신재생연계ESS설비용량_2018_2021.xlsx')
data.columns = ['연도', '월', '지역', '태양광', '풍력', 'ESS태양광', 'ESS풍력', '태양광ESS', '풍력ESS']
data = data[data['연도'] == 2021]
grp_ess = data.groupby('월')['태양광', '풍력', 'ESS태양광', 'ESS풍력'].sum()
grp_ess['태양광연계비율'] = grp_ess['ESS태양광'] / grp_ess['태양광'] * 100
grp_ess['풍력연계비율'] = grp_ess['ESS풍력'] / grp_ess['풍력'] * 100
grp_ess = grp_ess.reset_index()
#grp_ess = grp_ess.set_index('월')
print(grp_ess)
fig, ax1 = plt.subplots()
ax2 = ax1.twinx()
if type == 1:
grp_ess['태양광'].plot(kind='bar', ax=ax1, sharex=True)
#ax1 = sns.barplot(data=grp_ess, x='월', y='태양광')
ax1.set_ylabel('설비용량(MW)')
grp_ess['태양광연계비율'].plot(kind='line', ax=ax2, color='r', marker='o')
#ax2 = sns.lineplot(data=grp_ess, x='월', y='태양광연계비율')
ax2.set_ylabel('연계비율(%)')
plt.title('2021년 태양광 설비용량(MW) 및 ESS 연계비율(%)')
plt.xticks(np.arange(12), labels=[1, 2, 3, 4, 5, 6, 7, 8, 9, 10, 11, 12])
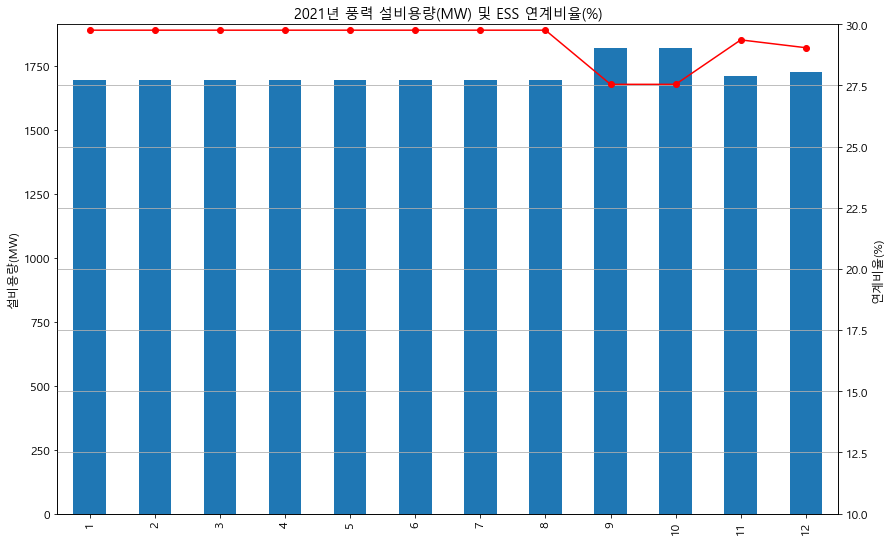
if type == 2:
grp_ess['풍력'].plot(kind='bar', ax=ax1, sharex=True)
ax1.set_ylabel('설비용량(MW)')
#grp_ess['태양광연계비율'].plot(kind='line', ax=ax2, color='r', marker='o')
grp_ess['풍력연계비율'].plot(kind='line', ax=ax2, color='r', marker='o')
ax2.set_ylabel('연계비율(%)')
plt.title('2021년 풍력 설비용량(MW) 및 ESS 연계비율(%)')
plt.ylim(10, 30) # 우측 y축 범위 설정
plt.xticks(np.arange(12), labels=[1, 2, 3, 4, 5, 6, 7, 8, 9, 10, 11, 12])
plt.grid()
plt.show()
In [17]:
ess(1) # 태양광
In [18]:
ess(2) # 풍력